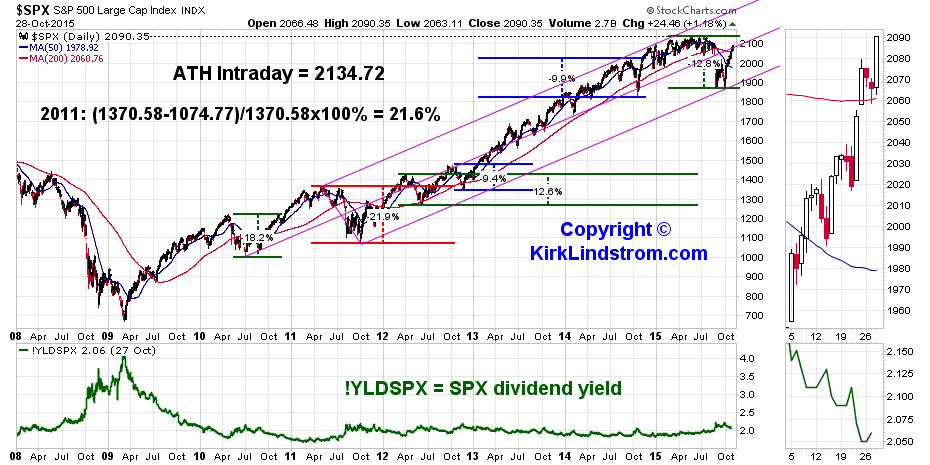
Today the S&P500 recovered all the losses made since it crashed below its 200 day moving average in August.


The final image shows how far below the peaks the markets were during at the closing low just over two months ago.
- Significant Profit taking before the August crash
- Significant buying while making and testing the lows
- Taking some very nice profits NOW that we've recovered.

The final image shows how far below the peaks the markets were during at the closing low just over two months ago.

- Sept. 29: Buying Opportunity: Market Testing August Lows
- Sept 9: Bob Brinker Market Projection & Outlook
- Brinker Moneytalk Radio Show Podcasts and Articles
